Ulysses' Capabilities
Ulysses is an end-to-end product - that is designed for a diverse group of users, with diverse skills, working on a diverse set of tasks in unison. Its many capabilities are seamlessly and optimally connected to facilitate individual workflows.
Data Vault and Ontologies

Ulysses allows bulk and incremental data ingestion from a variety of sources such as RDBMS, Hadoop, application logs, and social media platforms.
Being able to find all and the most relevant information quickly in order to meet business process quality standards and timelines in the most efficient and effective manner.
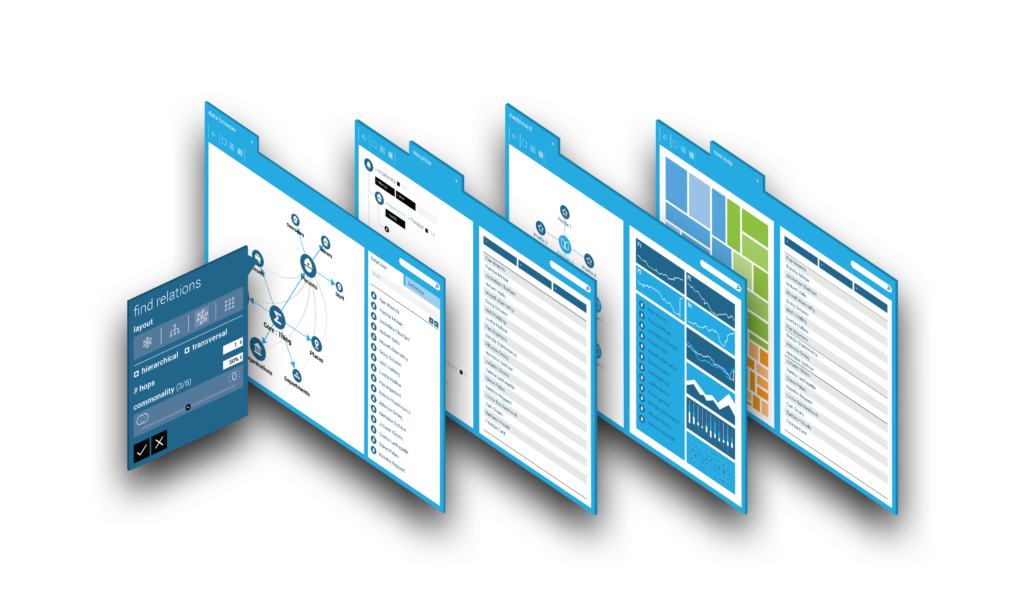
Relationship Finder

The Relationship Finder enables users to visually discover and explore existing relationships and commonalities between data entities.
The Relationship Finder also allows users to specify the preferred relationship proximity (“Number of Hops”) between different entities, and highlight key critical relationships using attribute and weightage filters.
360 View

With Ulysses, users can connect virtually to any data source easily without IT intervention. The 360° view dashboard provides an intuitive ‘Bubble View’ interface, empowering users to browse and discover relationships and information seamlessly on all data interactions and touch points.
“Naïve” is the opposite of “contextual”. Everything that customers do today with business intelligence (BI) tools is contextual – meaning within a specific context. For example – if you want to access any data it has to be through a pre-configured report or dashboard. All of the fields are pre-defined and hence provide data only within the boundaries of the report or dashboard parameters – the context. With Ulysses, a user can browse data much like they browse the www – dynamically and without any pre-defined reports or dashboards. Hence the use of the term Naïve.
Tabulizer

Utilizing one single intuitive interface, users can combine and connect information about diverse groups of entities for analysis and visualization. The feature is designed to be usable without any need to write complex code, or knowledge of ontologies. Tabulizer interacts seamlessly with related features such as 360 View, Pivot Table, Visualizer and Link Analytics Pro. Users can quickly convert multiple 360 views into traditional data presentation formats like tables, lists and charts, for use in reports or dashboards.
Naive Browsing

With a dynamic and highly customisable dashboard, users can define alert rules to flag out threshold alerts based on specific business rules. Users need not worry about data preparation as new data will be dynamically mapped, updated, and linked continually. This provides an accurate, updated, and complete 360° view of data entities.
The Parking Lot feature allows users to bookmark selected data attributes, save them, and revisit them for future analysis and comparison.
Self Service Analytics

provides a complete platform empowering users full flexibility with self-service data visualization and reporting capabilities. User skill levels will not be a concern as they can visually explore and build commonly used data explorations of their own. Self Service Analytics gives users flexibility with an easy to use drag and drop visualization interface without the need for specific IT skills.
Mobile data
Enable users to view and interact with dynamic dashboards on smart devices including Android and iOS.
Highly intuitive and easy to use dashboards
Self-service dash boarding capabilities empower users with the freedom and flexibility to explore data for analysis via a simple drag and drop interface.
Hierarchy levels
Allows users to drill-down into multi-dimensional data for trends and data discovery and analysis.
Auto charting capabilities
Ulysses automatically defines and determines the best-suited chart to display based on data attributes selected by users.
Wide variety of chart types
data can be presented into various presentations, e.g. stacked column chart that allows filtering and differentiating results by different colors.
Embedded analytics capabilities
users can create multiple Analytical models through a drag-and-drop web browser interface without data scientists!